Advertisement
Working with multiple plots can get messy fast. Sometimes you just want two charts side by side. Maybe a histogram on top, a scatter plot below. But setting them up from scratch can be a hassle if you’re not familiar with how layout works. That’s where matplotlib.pyplot.subplots() comes in. It handles the layout for you and gives you both the figure and axes objects in one go. Instead of writing extra lines to create and arrange plots, this one function simplifies the whole setup.
This article will explain how matplotlib.pyplot.subplots() works, how it fits into real Python plots, and how you can tweak it to get the layout and customization you want. Whether you’re plotting two graphs or a grid of twenty, this function is the one most people use for multi-plot work in Matplotlib.
The first thing to know is what happens when you call matplotlib.pyplot.subplots(). This function gives you two things: a Figure object and one or more Axes objects. The Figure is the outer container for your plots—the canvas. The Axes objects are the actual plots, where lines, bars, or any chart are drawn.
By default, calling plt.subplots() with no arguments gives you one figure with one set of axes. It’s the same as a single-plot setup:
python
CopyEdit
import matplotlib.pyplot as plt
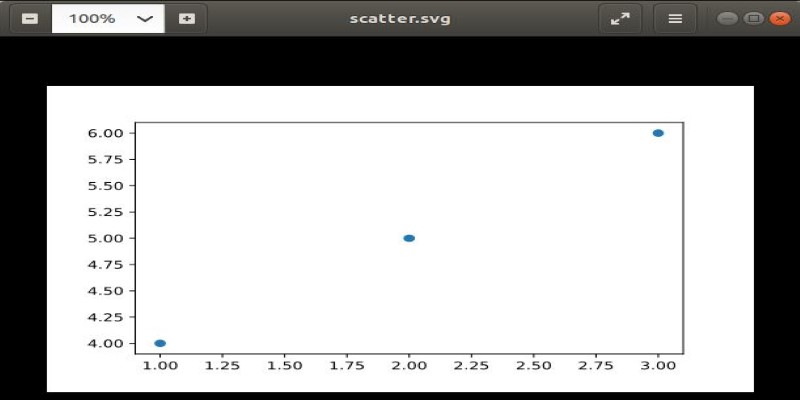
fig, ax = plt.subplots()
ax.plot([1, 2, 3], [4, 5, 6])
plt.show()
The variable fig is the figure container. The variable ax is the axes object. You call plotting functions on the ax, not the fig.
You can change the number of plots by passing in rows and columns. For example, plt.subplots(2, 2) gives you a 2x2 grid—four axes arranged across two rows and two columns. This makes it easy to manage multiple Python plots at once, all within a structured layout.
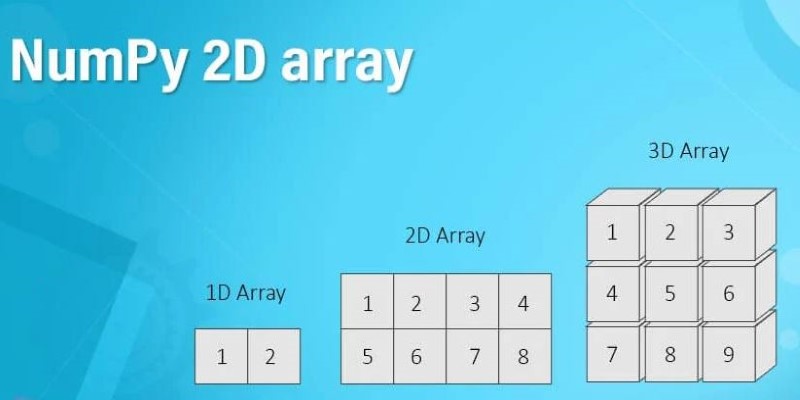
When you create multiple plots, the axes object returned can either be a single object or an array of objects. If you create one plot, ax is just an Axes object. If you create more than one, you get an array—usually a 2D NumPy array if you create a grid.
Here’s how you work with different shapes:
python
CopyEdit
# 1 row, 2 columns
fig, axes = plt.subplots(1, 2)
axes[0].plot([0, 1], [1, 2])
axes[1].plot([0, 1], [2, 3])
When you request a 1x2 layout, you get a list-like structure—one row with two Axes objects.
If you ask for a 2x2 layout, you get a 2D array:
python
CopyEdit
fig, axes = plt.subplots(2, 2)
axes[0, 0].plot([0, 1], [1, 1])
axes[1, 1].plot([0, 1], [3, 2])
To keep things simple, you can flatten the array if you don’t care about the row-column structure:
python
CopyEdit
axes = axes.flatten()
This makes working with many subplots in a loop much easier.
One reason people like matplotlib.pyplot.subplots() is the control it gives over layout and appearance. You can control the spacing between plots using the fig.subplots_adjust() method. You can even turn off axes for specific subplots if you don’t need them.
python
CopyEdit
fig, axes = plt.subplots(2, 2)
fig.subplots_adjust(hspace=0.5, wspace=0.3)
This sets the horizontal and vertical space between subplots.
There’s also sharex and sharey. These help when you want all your plots to align on the same axis scale. It keeps things tidy and readable.
python
CopyEdit
fig, axes = plt.subplots(2, 2, sharex=True, sharey=True)
It’s helpful when plotting similar data across multiple subplots. For example, showing different time series on the same time axis makes it easier to compare trends. This is often used when working with Python plots showing sales, stock prices, or sensor data.
Adding titles to each subplot helps guide the viewer. You can do this directly on each ax object.
python
CopyEdit
axes[0, 0].set_title("Top Left Plot")
You can also loop through the axes array and set properties in bulk. For example, if you want all your plots to have a grid:
python
CopyEdit
for ax in axes.flat:
ax.grid(True)
After building your layout, you can show or save the full figure using Matplotlib’s show() or savefig().
python
CopyEdit
plt.savefig("my_layout.png")
plt.show()
Using savefig() saves the entire figure as one image file. It includes all subplots and spacing, exactly as displayed. This is helpful when you want to include Python plots in a report, paper, or web dashboard.
Keep in mind that the figure size can affect how tight or loose your layout feels. You can set this when calling subplots():
python
CopyEdit
fig, axes = plt.subplots(2, 2, figsize=(10, 8))
This controls the total size of the figure. Larger sizes mean more space for each subplot. If you're using many small charts in a grid, adjusting figsize becomes necessary to avoid squished labels and unreadable axes.
Sometimes, you only want to keep a few axes and delete the rest. You can loop through and remove them using fig.delaxes() if needed. That adds flexibility to your plotting workflow, especially when working with dynamic data where the number of plots may change depending on filters, user input, or available categories in your dataset.
matplotlib.pyplot.subplots() in Python simplifies the work of plotting multiple charts in one go. It lets you set up a figure with a structured grid of axes, all in one line. You get back both the canvas and the individual plotting areas, and you can customize everything—spacing, labels, shared axes, and more. Whether you’re plotting two charts or twenty, this function is the easiest way to keep things organized. Once you understand how the axes array works and how to tweak layout and figure size, it becomes one of the most useful tools in the Matplotlib library. With just a few lines of code, you can manage complex Python plots without the clutter.
Advertisement
Want to organize your pandas DataFrame without confusion? This guide shows clear, practical ways to sort by values, index, custom logic, or within groups

Explore how Rabbit R1 enhances enterprise productivity with AI-powered features that streamline and optimize workflows.

Discover Oracle’s GenAI: built-in LLMs, data privacy guarantees, seamless Fusion Cloud integration, and more.

Master the Python list insert() method with this easy-to-follow guide. Learn how to insert element in list at specific positions using simple examples

Understand deepfakes, their impact, the creation process, and simple tips to identify and avoid falling for fake media.

Learn how to loop through dictionaries in Python with clean examples. Covers keys, values, items, sorted order, nesting, and more for efficient iteration

Salesforce brings generative AI to the Financial Services Cloud, transforming banking with smarter automation and client insights

Explore the key differences between AI, machine learning, and deep learning with practical insights and use case examples.
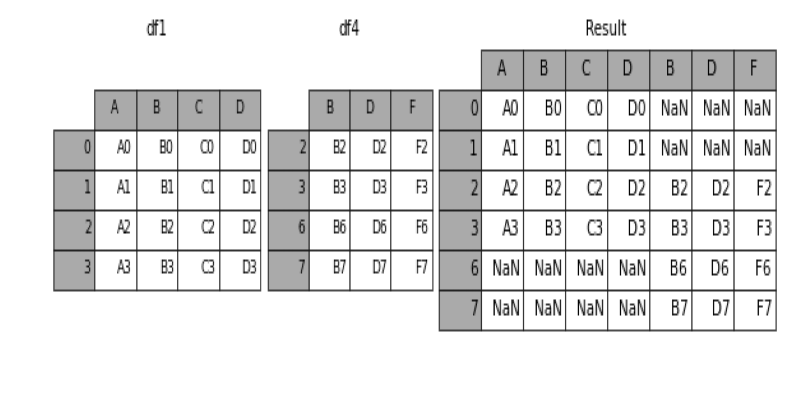
Learn how to concatenate two or more DataFrames in pandas using concat(), append(), and keys. Covers row-wise, column-wise joins, index handling, and best practices

Need to share a ChatGPT chat? Whether it’s for work, fun, or team use, here are 7 simple ways to copy, link, or export your conversation clearly

Discover top industries for AI contact centers—healthcare, banking fraud detection, retail, and a few others.

Discover different methods to check if an element exists in a list in Python. From simple techniques like using in to more advanced methods like binary search, explore all the ways to efficiently check membership in a Python list